Welcome to WordPress. This is your first post. Edit or delete it, then start writing!
Category: Uncategorized
-
Firewall Log

Firewall Log :
A firewall acts as a security guard for your network, deciding which traffic is allowed to pass in or out based on rules. It provides an important defense at the network’s borders. Reviewing firewall logs can give you valuable information about security events. Here are some key things you can learn from firewall logs:
-
Connections Allowed or Blocked: Logs show which connections are permitted and which are denied. If you see a lot of denied traffic, it could indicate that your firewall is being attacked.
-
Port and Protocol Usage: Each log entry shows the protocol (like TCP or UDP) and port numbers used in connections. You can analyze these to detect unusual activity.
-
Bandwidth Usage: The logs track how long each connection lasts and how much data is transferred. This helps monitor which users or departments are using the most bandwidth.
-
Tracking Address Translations: Firewalls often use Network Address Translation (NAT) or Port Address Translation (PAT). Logs can track these translations, helping you trace which internal user accessed external servers or if internal attacks were launched.
Each firewall vendor might have a slightly different log format. For example, Linux firewalls use a “syslog” format, which includes a timestamp, device ID, and detailed information like IP addresses, ports, and rule severity levels. This data helps you understand and trace the flow of traffic through your network.
By regularly reviewing firewall logs, you can spot security issues early and adjust your rules to improve your network’s defenses.
Because firewalls collect a lot of data but often have limited storage space, it’s important to use a log collection tool to prevent losing data when logs fill up or are cleared. The amount of logging you can do depends on how fast your system can process events. If too many events are generated, the system can become overwhelmed, making it vulnerable to “blinding” attacks. In such attacks, an adversary floods the system with traffic, hoping that when the real attack happens, the system won’t record all of it. It’s also important to store logs for a long time in case you need to investigate how a past attack occurred.
Firewall Configuration Changes :
In the past, network security mainly focused on protecting the perimeter, assuming that keeping attackers out would keep everything secure. While modern security methods go beyond just the perimeter, firewalls still play a crucial role in protecting networks. Any service that connects to the internet should be behind a firewall. Firewalls should be configured to only allow traffic through authorized ports and for specific hosts.
At the internet edge, firewalls are often set up in a demilitarized zone (DMZ). This setup uses:
-
An external firewall to control traffic between the internet and the servers in the DMZ.
-
An internal firewall to protect the local network (LAN) from the DMZ.
Services like websites, email, VoIP, and remote access (like VPN) are hosted in the DMZ to protect the rest of the network.
Firewall Rulesets :
Firewall rules are organized in a list, where each rule is checked one by one from top to bottom. If a rule matches the traffic, it will be allowed or blocked based on that rule. The most important rules should be placed at the top, and the last rule usually blocks anything that doesn’t match the other rules (this is called “implicit deny”).
Key principles for setting firewall rules include:
-
Block spoofed addresses: Block traffic from private, loopback, and multicast IPs, as well as addresses that haven’t been allocated yet (bogons).
-
Block certain protocols: Block protocols like ICMP, DHCP, and SMB that should only work locally.
-
Consider IPv6 traffic: Ensure rules are in place for IPv6, either blocking it or allowing only authorized traffic, as many systems use IPv6 by default.
Regular testing (through methods like threat hunting or penetration testing) and reviewing incidents help ensure firewall rules are working properly.
Drop vs. Reject in Firewall Rules
In firewalls, when a “deny” rule is applied, it can be implemented in two ways:
-
Drop: The packet is discarded silently without informing the client. This makes it difficult for attackers to figure out if a port is open or closed but can also complicate troubleshooting for legitimate users.
-
Reject: The firewall sends a response to the client, either a TCP RST (for TCP traffic) or an ICMP “port/protocol unreachable” (for UDP traffic). This helps legitimate users by letting them know the connection is blocked but can give attackers more information.
Choosing between “drop” or “reject” depends on the balance between security and usability.
Egress Filtering: What It Is and Why It’s Important :
While many organizations traditionally focused on ingress filtering (blocking harmful traffic from entering the network), egress filtering is now just as crucial. Egress filtering controls what traffic can leave the network, helping to stop malware from communicating with external Command & Control (C&C) servers if internal systems are compromised.
Key guidelines for egress filtering include:
-
Allow only authorized ports: Only allow necessary applications to send traffic out through specific ports and, if possible, limit traffic to trusted Internet destinations.
-
Control DNS lookups: Restrict DNS queries to trusted DNS servers, like your own, your ISP’s, or secure public DNS services such as Google or Quad9.
-
Block bad IPs: Prevent access to IP ranges known for malicious activity, using lists like DROP.
-
Limit Internet access: Block any subnets or devices that don’t need to access the Internet, such as internal servers or specialized systems like ICSs (industrial control systems).
By applying these rules, you reduce the chances of malicious communication, though attackers can still use trusted services like cloud platforms to hide their activities.
Firewalking: A Network Mapping Technique :
Firewalking is a method used by cyber attackers to explore and map out a network’s internal structure by bypassing firewalls. The goal is to determine which Access Control List (ACL) rules are in place and identify the ports and source addresses allowed to communicate.
Here’s how it works:
-
Identify Open Ports: The attacker first scans the perimeter firewall to find which ports are open.
-
Send a Crafted Packet: Next, they create a packet specifically for one of these open ports. This packet has a Time To Live (TTL) value set to one more than the firewall’s limit.
-
Wait for a Response: If the packet passes through the firewall and reaches a host on the internal network, that host will send back a notification indicating that the TTL has been exceeded.
How to Protect Against Firewalking :
To mitigate the risks associated with firewalking, organizations can:
-
Use Network Address Translation (NAT): This hides the internal IP addresses from attackers, making it difficult for them to determine the internal network layout.
-
Block Outgoing ICMP Messages: Preventing the firewall from sending back ICMP status messages can reduce the effectiveness of this technique, making it harder for attackers to gain information about the network.
By implementing these measures, networks can better defend against firewalking attempts and protect their internal resources.
Conclusion: Key Concepts in Firewall Management and Security
-
Firewall Log Review: Regularly reviewing firewall logs is essential for identifying patterns in allowed and denied traffic. This analysis helps detect potential security breaches and ensures that firewall rules are effectively implemented. It provides valuable insights into bandwidth usage, port usage, and address translation, aiding in the overall security posture.
-
Firewall Configuration Changes: Maintaining an effective firewall configuration is crucial for protecting internet-facing services. Firewalls should only allow authorized traffic while blocking unauthorized access. This is often managed through a demilitarized zone (DMZ) setup, where external firewalls control access between the internet and internal networks.
-
Firewall Rulesets: The rulesets within a firewall’s Access Control List (ACL) dictate how traffic is processed. Important rules should be prioritized at the top, with a default rule to block any unmatched traffic. Principles include blocking suspicious IP addresses and ensuring proper IPv6 configurations to prevent unauthorized access.
-
Drop vs. Reject in Firewall Rules: When a packet is denied, it can either be dropped (discarded silently) or rejected (responded to with an error). Dropping packets can obscure the attacker’s view of the network but can complicate troubleshooting for legitimate users.
-
Egress Filtering: This process involves restricting outbound traffic to prevent compromised internal hosts from communicating with external command and control (C&C) servers. Implementing strict egress rules is essential for modern cybersecurity and requires careful configuration to avoid interrupting authorized activities.
-
Firewalking: Firewalking is a technique used by attackers to probe firewall rules and map internal networks from the outside. It involves sending crafted packets to identify open ports and receiving notifications from internal hosts. Mitigation strategies include using NAT and blocking outgoing ICMP messages to protect the internal network layout.
Overall, effective firewall management involves ongoing monitoring, configuration, and adaptation to emerging threats, ensuring a robust defense against potential attacks.
-
-
Trend Analysis

Trend analysis
Trend analysis is like looking at a graph of your security data over time to spot patterns and predict what might happen in the future.
Trend analysis is like looking at a graph of your security data over time. You’re looking for patterns: are attacks increasing? Are certain types of attacks becoming more common?
By spotting these trends, you can:
-
Predict future attacks: If you see a certain type of attack becoming more frequent, you can prepare for it.
-
Minimize damage: Even if you can’t stop an attack, understanding the trends can help you reduce the harm it causes.
-
Understand past attacks better: Sometimes, after an attack happens, you might think you know why it occurred. But by looking at trends over a longer period, you might realize the real reason was something different. It’s like looking back at a puzzle and seeing a piece you missed before.
Spotting trends in security data is tricky if you’re just looking at individual log entries. It’s like trying to understand the weather by looking at individual raindrops. You need a broader view. That’s where visualization tools come in. They help you see how the number or frequency of certain security events changes over time.
Here are three main types of trend analysis:
-
Frequency-based: This establishes a “normal” baseline for how often something happens (like how many DNS errors you get per hour). If the number suddenly goes above or below that baseline, it triggers an alert. Think of it like your heart rate monitor – if your heart rate goes too high or too low, it sets off an alarm.
-
Volume-based: This looks at the overall amount of data. For example, if your security logs are suddenly growing much faster than usual, it could mean something is happening that needs investigation. It’s also used for network traffic – a sudden spike in traffic could be an attack. Or, if a computer’s hard drive is suddenly filling up, it might mean someone is storing stolen data on it.
-
Statistical deviation: This uses math to find data points that are significantly different from the norm. It uses concepts like “mean” (average) and “standard deviation” (how spread out the data is). Imagine a graph showing normal user activity and privileged user activity. A data point that falls far outside those groups might indicate a compromised account. It’s like finding an outlier in a group – someone who doesn’t fit in.
Trend analysis relies on carefully chosen metrics to be effective. Since analyst time is valuable, you want to track metrics that give you the most useful information. Here are some key areas for trend analysis:
-
Security Operations Performance:
-
Number of Alerts and Incidents: Tracking these helps you see if your security posture is improving or declining.
-
Detection/Response Times: Measuring how quickly you detect and respond to incidents shows the effectiveness of your security team.
-
Cost/Impact (Optional): While harder to measure, you could try to estimate the financial impact of security incidents or the time lost due to them.
-
-
Network and Host Metrics: These provide insights into network and system activity:
-
Network Traffic: Track the volume of internal and external network traffic to identify unusual spikes or patterns.
-
Log-ons/Log-on Failures: Monitor successful and failed login attempts to detect unauthorized access attempts.
-
Active Ports: Track the number of open ports on your systems to identify potential vulnerabilities.
-
Authorized/Unauthorized Devices: Monitor the number of devices connected to your network to detect unauthorized devices.
-
Instances of Malware: Track the number of malware infections to assess the effectiveness of your anti-malware solutions.
-
Patching Compliance: Measure how well your systems are kept up-to-date with security patches.
-
Vulnerability Scan Results: Monitor the number and severity of vulnerabilities identified by vulnerability scans.
-
Here are some additional areas for trend analysis, along with an explanation of how it can help defend against certain attack types:
-
Training/Threat Awareness:
-
Metrics: Number of training programs delivered, employee knowledge levels (through assessments).
-
Benefit: Tracks the effectiveness of security awareness training and helps identify areas where employees need more education.
-
-
Compliance:
-
Metrics: Percentage of compliance targets met.
-
Benefit: Monitors compliance with security regulations and identifies areas where policies are not being followed. It also helps distinguish between stricter targets and actual policy violations.
-
-
External Threat Levels:
-
Metrics: Information from threat intelligence feeds about the overall threat landscape.
-
Benefit: Keeps you informed about emerging threats and allows you to proactively adjust your defenses.
-
Trend Analysis and Sparse Attacks:
Trend analysis can be particularly helpful against sparse attacks. These attacks are designed to be subtle and difficult to detect. They might involve infrequent malicious activity designed to blend in with normal traffic. Here’s how trend analysis helps:
-
Identifying Subtle Patterns: Even if individual events seem harmless, trend analysis can reveal a pattern of suspicious activity over time. It’s like noticing a slow leak – one drop might not be a problem, but a growing puddle is.
-
Reducing Alert Fatigue: By focusing on trends, you can reduce the number of individual alerts, allowing analysts to focus on more significant issues. This helps prevent alert fatigue, where so many alerts are generated that some are inevitably missed.
Trend Analysis and Evolving Attack Techniques:
Attackers constantly change their tactics. Trend analysis helps you stay ahead of the curve:
-
Adapting to New Techniques: By tracking trends in attack techniques (like the shift from IRC to SSL tunnels for botnet command and control), you can update your security controls to address the latest threats. This requires staying current with threat intelligence and research. Just because a certain attack method was popular in the past doesn’t mean it won’t be used again.
-
Proactive Defense: Trend analysis allows you to be proactive, rather than reactive. By identifying emerging threats, you can prepare your defenses before an attack occurs.
Turning raw security data into useful insights involves a crucial step: preparing the data for analysis. This often means transforming it into a more manageable and efficient format. While some of this work might be automated by your security tools, you’ll likely need to fine-tune SIEM rules or manually manipulate data using your logging and tracing tools. Several technical skills can be invaluable in this process:
-
Programming/Scripting: Skills in programming languages (like Python, Java) or scripting languages (like Bash, PowerShell) let you create custom automation tools to handle data preparation tasks. This can be especially useful for repetitive or complex transformations.
-
Regular Expressions (Regex): The ability to write regular expressions is essential for pattern matching and searching within text-based data, like log files. Regex allows you to extract specific information, filter out irrelevant data, and reformat data into a consistent structure. It’s a powerful tool for parsing and manipulating text.
SIEM correlation rules are the heart of how a SIEM system turns raw data into meaningful security alerts. “Correlation” means connecting the dots between individual pieces of data to understand the bigger picture – a potential security incident.
A SIEM correlation rule is essentially a set of instructions that the SIEM follows. It’s like saying, “IF these specific conditions are met, THEN trigger an alert.” These rules use:
-
Logical expressions: “AND” (both conditions must be true) and “OR” (at least one condition must be true).
-
Operators: Symbols that define relationships between data, such as:
-
== (equals/matches)
-
< (less than)
-
> (greater than)
-
in (contains)
-
Example:
A single failed login attempt is usually not a big deal. But multiple failed logins for the same account within a short period is suspicious. A correlation rule could look like this (using a simplified syntax):
Error.LogonFailure > 3 AND LogonFailure.User == “SpecificUsername” AND Duration < 1 hour
This rule says: “IF there are MORE THAN 3 failed login attempts AND they are for the SAME USER and they occur WITHIN 1 HOUR, THEN trigger an alert.”
This kind of rule helps the SIEM focus on the truly important events and avoid generating alerts for every little thing. It’s about finding patterns that indicate a real problem.
-
Stateful Data and Memory: Some correlation rules need to remember past events to make decisions. For example, the “multiple failed logins” rule needs to track the number of failed attempts within a specific time window. This requires storing data about each login attempt (the “state” of the login process), which consumes memory. If you have many of these rules, the memory usage can become significant, impacting the SIEM’s performance. SIEMs often have limits on how long they store this “state” data.
-
Normalized Data is Essential: Correlation rules rely on normalized data. This means that data from different sources needs to be in a consistent format. Take IP addresses, for example. An IP address by itself isn’t very useful. You need to know context – is it the source or destination IP? Is it a public or private IP? Is it behind a NAT (Network Address Translation) device? If the SIEM doesn’t understand these nuances, it can’t accurately correlate data from different sources, like a firewall log and a web server log. Similarly, time zones and clock synchronization issues can also prevent accurate correlation.
-
SIEM Queries: Retrieving Stored Data: While correlation rules trigger alerts in real-time as data comes in, queries are used to retrieve and analyze data that’s already stored in the SIEM. They’re used for investigations, reporting, and creating visualizations.
-
Basic Query Structure: SIEM queries typically follow this structure:
SELECT (Specific Fields) WHERE (Conditions) SORTED BY (Specific Fields)
For example:
SELECT SourceIP, DestinationIP, Timestamp WHERE EventType == “FirewallDeny” SORTED BY Timestamp DESC
This query would retrieve the source and destination IP addresses and timestamps for all firewall deny events, sorted from the most recent to the oldest. Queries are essential for digging deeper into security events and understanding the context surrounding them.
String Search and Regular Expressions (Regex)
When looking for specific information in logs or writing SIEM rules, you often need to search for patterns within text. This is where string search and regular expressions come in.
A regular expression (regex) is a powerful way to define a search pattern. It’s like a mini-language for describing text you want to find. Instead of just searching for a literal word, regex lets you search for complex patterns.
String search uses regular expressions (regex) to find patterns in text. Regex is a special syntax with characters that act as operators, quantifiers (how many times to match), and groupers. Common regex elements include […] (character sets), + (one or more), * (zero or more), ? (zero or one), {} (specific counts), and (…) (grouping).
The grep command is a powerful tool in Unix-like systems for searching text files. It uses string matching or regular expressions (regex) to find specific patterns.
Here’s a breakdown of the examples you provided:
-
grep -F 192.168.1.254 access.log: This searches the access.log file for lines containing the literal string “192.168.1.254”. The -F option tells grep to treat the search term as a literal string, not a regular expression. It will print any line containing that exact sequence of characters.
-
grep “192.168.1.254” : This searches all files in the current directory () for lines containing the literal string “192.168.1.254”. Double quotes are used here to specify the literal string when searching multiple files.
-
grep -r 192\.168\.1\.[\d]{1,3} .: This is the most powerful example.
-
-r: This option tells grep to search recursively, meaning it will search all files in the current directory and all subdirectories.
-
192\.168\.1\.[\d]{1,3}: This is the search pattern, using regular expression syntax.
-
\.: The backslashes escape the periods. A period in regex usually means “any character,” but we want to search for a literal period.
-
[\d]{1,3}: This matches one to three digits. [\d] means “any digit,” and {1,3} means “one to three occurrences.”
-
-
.: This specifies the starting directory for the search (the current directory).
-
4. · cut Command: Extracts specific parts of each line from a file, either by character position (-c) or by fields separated by a delimiter (-f and -d).
5. · sort Command: Changes the order of lines in a file, using delimiters (-t) and key fields (-k). Options include reverse order (-r) and numerical sorting (-n).
6. · Piping (|): Connects the output of one command to the input of another, creating a chain of commands for complex data manipulation.
7. · head and tail Commands: Display the first (head) or last (tail) 10 lines of a file (or a specified number of lines). tail is often used for viewing recent log entries
Scripting automates tasks, especially useful for repetitive actions. Bash (Linux/macOS) and PowerShell (Windows) are common scripting languages, though Python and Ruby are also used. Bash scripts can combine commands (like grep, cut) with programming elements (variables, loops, etc.) to automate complex tasks. The example script finds “NetworkManager” entries in a syslog, trims the lines, and saves the output to a file.
awk: A scripting language designed for data extraction and manipulation from files or streams. awk scripts use patterns and actions within curly braces {} to process data. If no pattern is given, the action applies to all data. If no action is given, the entire line is printed.
WMIC (Windows Management Instrumentation Command-line): A tool for managing and retrieving information about Windows systems, including event logs. The NTEVENT alias within WMIC allows querying and retrieving specific log entries from remote Windows machines, using criteria like LogFile and EventType. The GET command specifies which fields to display.
WMIC (Windows Management Instrumentation Command-line) Example: The provided WMIC command retrieves audit failure events (EventType 5) from the Security log of a Windows system. It then displays the SourceName, TimeGenerated, and Message for each matching event. This allows remote log analysis without directly accessing the target machine.
PowerShell: A powerful scripting and automation tool for Windows. It uses “cmdlets” (Verb-Noun commands) to perform actions. The example PowerShell script retrieves the 5 newest logon failure events (InstanceId 4625) from the Security log and saves the TimeWritten and Message to a file named log-fail.txt. Write-Host is similar to echo in Bash, printing text to the console.
-
-
Analysis SIEM
SIEM Dashboards:
Imagine a SIEM as a security control center. Dashboards within this center provide a visual overview of your security status in real-time. Here’s what they do:
-
Triage Alerts: Like a busy emergency room, SIEM dashboards help you quickly assess security alerts. They highlight critical issues (true positives) that need immediate attention and filter out unimportant ones (false positives).
-
Monitor Data Sources: Dashboards ensure all your security sensors (like firewalls, intrusion detection systems) are sending data correctly. It’s like checking if all your security cameras are working properly.
-
Track Global Threats: Dashboards display information about cyber threats happening worldwide. This helps you understand the current threat landscape and prioritize your own security efforts.
-
Vulnerability Scanning and Management: SIEM dashboards can display key information related to vulnerability management, such as:
-
Number of vulnerabilities: Track the total number of vulnerabilities discovered across the organization.
-
Vulnerability severity: Categorize vulnerabilities by severity level (e.g., critical, high, medium, low) to prioritize remediation efforts.
-
Remediation progress: Monitor the number of vulnerabilities that have been addressed and track progress towards remediation goals.
-
Vulnerability trends: Identify emerging vulnerabilities and track the overall vulnerability landscape within the organization.
-
-
Threat Hunting: SIEM dashboards can help identify opportunities for threat hunting by:
-
Visualizing alert trends: Identify unusual spikes in alerts, which could indicate a potential attack in progress.
-
Correlating alerts: Analyze alerts across different sources to identify potential attack chains or coordinated attacks.
-
Integrating threat intelligence: Display threat intelligence feeds to highlight emerging threats and identify potential attack vectors.
-
Analyzing user behavior: Identify anomalies in user behavior that could indicate malicious activity.
-
Dashboard Visualizations:
-
Pie charts:
-
Show the distribution of vulnerabilities by severity level.
-
Display the proportion of alerts categorized as true positives, false positives, or under investigation.
-
-
Line graphs:
-
Track the number of vulnerabilities over time.
-
Monitor the number of security incidents over time.
-
Analyze trends in user login activity.
-
-
Bar graphs:
-
Compare the number of vulnerabilities across different systems or departments.
-
Show the distribution of alerts by source or type.
-
-
Stacked bar graphs:
-
Compare the number of vulnerabilities by severity level across different time periods.
-
Analyze the distribution of security incidents by type across different departments.
-
-
Gauges:
-
Display the overall security posture of the organization, such as the percentage of vulnerabilities remediated or the number of open security incidents.
-
Analysis and Detection Methods:
SIEMs analyze security data to find threats. They use rules to identify suspicious activity and trigger alerts.
-
Simple Rules: These rules are like basic instructions, like “If someone tries to log in from a strange location AND fails, alert me.”
-
Challenges: These simple rules often create many false alarms (like a harmless login attempt from a different location). They also struggle to detect new types of attacks that haven’t been seen before (called “zero-day” attacks).
Essentially, SIEMs try to find patterns that indicate a potential threat. However, creating the right rules and filtering out false alarms is crucial for effective threat detection.
Simple rules in SIEMs, like “If X happens AND Y happens, then alert,” are a good start, but they can miss a lot.
Heuristic Analysis is like having a detective look at the bigger picture. Instead of just following strict rules, it tries to understand the “why” behind the events. For example, if someone usually logs in from their office and suddenly logs in from a different country, heuristic analysis would consider this suspicious even if there’s no specific rule against it.
Machine Learning takes this even further. It allows the SIEM to learn from past events, like a detective studying past crime cases. It can identify patterns and anomalies in data that humans might miss. This helps the SIEM detect new and evolving threats that simple rules wouldn’t catch.
-
Simple Rules: Like following a strict recipe.
-
Heuristic Analysis: Like a chef improvising based on experience and intuition.
-
Machine Learning: Like a robot chef that learns and adapts its cooking based on feedback.
By using these advanced techniques, SIEMs can become much more effective at detecting threats and keeping your systems secure.
Behavioral Analysis
Imagine you have a friend who usually arrives at work around 9 AM and leaves around 5 PM. Suddenly, they start arriving at 3 AM and leaving at 10 PM. This unusual behavior might indicate something is wrong.
Behavioral analysis in cybersecurity works similarly. It focuses on understanding the typical behavior patterns of users and devices within a network.
-
Building a Profile: The system observes normal activity, like login times, access locations, and file access patterns. It then creates a “profile” of what’s considered normal for each user and device.
-
Detecting Anomalies: Any significant deviation from this normal behavior is flagged as an anomaly and triggers alerts. This could include:
-
Unusual login times: Logging in at odd hours.
-
Accessing sensitive data outside of normal working hours.
-
Sudden increase in data transfer activity.
-
Logging in from an unusual location.
-
By analyzing normal behavior and identifying deviations, behavioral analysis helps detect threats that might otherwise go unnoticed. It’s like noticing when your friend starts acting strangely, which might indicate something is wrong.
behavioral analysis requires time to build accurate baselines. Initially, there might be some false alarms as the system learns and adapts.
Anomaly Analysis: Finding the Unusual
Imagine you’re at a concert. Most people are standing and enjoying the music. Suddenly, someone starts running around wildly. This unusual behavior stands out because it doesn’t conform to the expected behavior of concert-goers.
Anomaly analysis in cybersecurity works similarly.
-
Defining Normal: It establishes rules or expectations for how systems and networks should behave. For example:
-
Network Traffic: How data packets should be structured and exchanged.
-
System Processes: How applications and services should run.
-
-
Identifying Deviations: The system constantly monitors for any events that deviate from these established norms. For example:
-
Unexpected network traffic: Packets that violate network protocols.
-
Unusual system activity: Unexpected changes to system configurations or resource usage.
-
Benefits:
-
Proactive Threat Detection: Can identify threats that traditional methods might miss, such as new and emerging threats.
-
Reduced Reliance on Signatures: Doesn’t rely on pre-defined signatures of known threats, which can be bypassed by new and evolving malware.
Anomaly analysis is like noticing someone behaving strangely at a concert. It helps identify unusual activity that might indicate a potential threat, even if you don’t know exactly what that threat.
-
-
Analysis and Query SIEM Data
Analyze and Query Logs and SIEM Data
SIEM dashboards are crucial for effectively managing security operations. They provide a centralized and visually intuitive way to monitor security data, identify threats, and streamline incident response. Here’s a breakdown of their key functions and benefits:
Key Functions of SIEM Dashboards:
-
Alert Triage:
-
Prioritize and categorize alerts, distinguishing between true positives that require immediate attention and false positives that can be safely dismissed.
-
-
Data Source Monitoring:
-
Continuously monitor the health and performance of data sources, ensuring that log collection and information feeds are functioning as expected.
-
-
Threat Intelligence Integration:
-
Incorporate threat intelligence feeds (CTI) to stay informed about emerging threats, identify potential impacts of global cyber events, and proactively adjust security posture.
-
-
Vulnerability Management:
-
Track identified vulnerabilities, monitor remediation progress, and prioritize remediation efforts based on risk level.
-
-
Threat Hunting:
-
Identify and investigate suspicious activities that may have evaded initial detection mechanisms.
-
Common Dashboard Visualizations:
-
Pie Charts:
-
Effectively visualize the distribution of different alert categories or threat types, providing a clear overview of the overall security landscape.
-
-
Line Graphs:
-
Track trends over time, such as the volume of alerts, the number of security incidents, or the effectiveness of security controls.
-
-
Bar Graphs:
-
Compare the frequency or severity of different threats across various categories or time periods.
-
-
Stacked Bar Graphs:
-
Provide a more nuanced comparison by showing the breakdown of different categories within a larger group, such as the number of alerts by severity level across different departments.
-
-
Gauges:
-
Visually represent the status of key security metrics, such as the number of open incidents or the percentage of vulnerabilities remediated, with clear thresholds for critical levels.
-
By effectively utilizing SIEM dashboards, security teams can gain valuable insights into their security posture, proactively identify and respond to threats, and ultimately improve their overall security effectiveness.
Selecting the right metrics for a SIEM dashboard is crucial for effective security monitoring.
Key Considerations:
-
Actionability: Focus on metrics that directly inform decisions and drive action.
-
Conciseness: Limit the number of widgets to avoid overwhelming analysts.
-
Visualization: Choose visualizations that effectively communicate the data, such as:
-
Pie charts: Show the proportion of different categories (e.g., threat types).
-
Line graphs: Track trends over time (e.g., number of alerts, security incidents).
-
Bar graphs: Compare values across different categories (e.g., vulnerabilities by severity).
-
Stacked bar graphs: Show the breakdown of categories within a larger group.
-
Gauges: Display the status of key metrics (e.g., percentage of vulnerabilities remediated) with clear thresholds.
-
Common Security KPIs:
-
Vulnerability Management:
-
Number of vulnerabilities discovered and remediated (by service type)
-
-
Threat Detection & Response:
-
Number of failed log-ons/unauthorized access attempts
-
Number of security incidents reported (last month)
-
Average incident response time
-
-
Compliance & Posture:
-
Number of systems out of compliance with security requirements
-
-
Employee Security Awareness:
-
Number of employees who have completed security training
-
-
Development Security:
-
Percentage of test coverage on in-house developed applications
-
Tailoring Dashboards to Different Audiences:
Create separate dashboards for different audiences to ensure they receive the most relevant information:
-
Security Team: Focus on threat detection, incident response, and vulnerability management metrics.
-
Management: Emphasize high-level metrics like the number of security incidents, the overall security posture, and the costs associated with security breaches.
By carefully selecting and visualizing key performance indicators, SIEM dashboards can empower security teams to make informed decisions, proactively address threats, and improve overall security posture.
SIEM Analysis and Detection Methods
SIEMs analyze security data to identify potential threats and generate alerts. However, these systems often produce a high volume of false positives, making it crucial for analysts to understand the underlying detection methods.
Simple Correlation Methods:
-
Signature Detection: This method relies on predefined patterns or signatures of known threats. The SIEM compares incoming data against these signatures and generates alerts when a match is found.
-
Rules-Based Analysis: This involves creating rules that define specific conditions or sequences of events that may indicate a security threat. For example, a rule might trigger an alert if a user logs in from an unusual location and then attempts to access sensitive data.
Limitations of Simple Correlation:
-
High False Positive Rates: Rules-based systems often generate a large number of false positives, overwhelming analysts and wasting valuable time.
-
Limited Effectiveness Against Novel Threats: These methods are primarily effective against known threats. They struggle to detect new or “zero-day” attacks that have not been previously encountered.
More Advanced Techniques:
To overcome these limitations, SIEMs are increasingly incorporating more sophisticated analysis techniques, such as:
-
Anomaly Detection: This involves identifying deviations from normal behavior patterns. By analyzing historical data and establishing baselines, SIEMs can detect unusual activity that might indicate a threat.
-
Machine Learning: Machine learning algorithms can analyze vast amounts of data to identify complex patterns and relationships that may be indicative of malicious activity. This enables the detection of subtle and evolving threats that might be missed by traditional methods.
-
User and Entity Behavior Analytics (UEBA): UEBA focuses on understanding and analyzing the normal behavior of users and entities within an organization. By identifying deviations from established baselines, UEBA can detect suspicious activity, such as unusual login times, large file transfers, or unexpected access to sensitive data.
Key Considerations:
-
Fine-tuning Rules: Regularly review and refine rules to minimize false positives and improve detection accuracy.
-
Leveraging Threat Intelligence: Integrate threat intelligence feeds to enhance threat detection capabilities and stay informed about the latest threats and attack techniques.
-
Continuous Monitoring and Improvement: Continuously monitor the performance of SIEM rules and make necessary adjustments based on observed behavior and evolving threat landscape.
By employing a combination of these techniques, SIEMs can provide more accurate and timely threat detection, enabling organizations to proactively respond to security incidents and mitigate potential damage.
Heuristic Analysis and Machine Learning in SIEM
While simple rule-based systems (“IF x AND (y OR z)”) provide a foundation for threat detection, they often fall short in identifying sophisticated and evolving attacks. To enhance their capabilities, SIEMs incorporate more advanced techniques like heuristic analysis and machine learning.
Heuristic Analysis:
-
Beyond Simple Rules: Heuristic analysis allows the SIEM to go beyond rigid rule-based logic. It enables the system to identify patterns and behaviors that may not perfectly match predefined rules but still exhibit characteristics indicative of malicious activity.
-
Contextual Understanding: Heuristics help the system understand the context of events. For example, a single failed login attempt might not be alarming, but a series of failed login attempts from the same IP address within a short timeframe could be suspicious. Heuristic analysis helps the SIEM evaluate these events in context, considering factors like time, location, and user behavior.
Machine Learning:
-
Automated Learning and Adaptation: Machine learning algorithms enable the SIEM to learn and adapt to new threats without constant human intervention. By analyzing historical data and observing real-world attacks, the system can identify patterns, build models, and continuously improve its threat detection capabilities.
-
Enhanced Threat Detection: Machine learning algorithms can identify subtle and complex patterns that might be missed by traditional rule-based systems. They can detect anomalies in user behavior, network traffic, and system activity, providing valuable insights into potential threats.
-
Reduced False Positives: By learning from both positive and negative examples, machine learning algorithms can help reduce the number of false positives, improving the accuracy and efficiency of threat detection.
The Role of Honeypots and Honeynets:
Honeypots and honeynets play a crucial role in training machine learning models. These systems are designed to attract and trap attackers, providing a controlled environment for observing real-world attack techniques. By analyzing the behavior of attackers within these environments, machine learning algorithms can learn to identify and mitigate similar threats in the real world.
In Summary:
Heuristic analysis and machine learning are critical advancements in SIEM technology. By moving beyond simple rule-based systems, these techniques enable organizations to better detect and respond to evolving threats, improve the accuracy and efficiency of their security operations, and stay ahead of the ever-changing cyber threat landscape.
Behavioral Analysis
-
Focus: Understanding and analyzing the normal behavior patterns of users, entities (like devices), and systems within an organization.
-
Key Concept: Identifying deviations from established norms as potential security threats.
-
How it Works:
-
Establishing Baselines: The system observes and learns the typical behavior of users, devices, and systems. This includes factors like login times, access locations, file access patterns, and resource usage.
-
Detecting Anomalies: Any significant deviation from these established baselines is flagged as an anomaly and triggers alerts. For example, a user logging in from an unusual location, accessing sensitive data outside of normal working hours, or exhibiting a sudden increase in data transfer activity could be considered anomalous.
-
-
Benefits:
-
Proactive Threat Detection: Can identify threats that might be missed by signature-based or rule-based systems, such as insider threats and zero-day attacks.
-
Improved Accuracy: By focusing on deviations from normal behavior, behavioral analysis can help reduce the number of false positives.
-
Anomaly Analysis
-
Focus: Identifying events that deviate from expected patterns or standards.
-
Key Concept: Defining and enforcing rules or expected outcomes for various system activities.
-
How it Works:
-
Defining Rules: Establish rules or expectations for normal system behavior, such as protocol compliance, data integrity checks, and expected traffic patterns.
-
Detecting Deviations: The system monitors for any events that violate these predefined rules or expectations. For example, it might flag packets that violate network protocols, unexpected changes to system configurations, or unusual system resource usage.
-
-
Benefits:
-
Proactive Threat Detection: Can identify a wide range of threats, including network intrusions, data breaches, and system compromises.
-
Reduced Reliance on Signatures: Unlike signature-based detection, anomaly analysis does not rely on prior knowledge of specific threats, making it more effective against novel and emerging threats.
-
Key Differences:
-
Focus: Behavioral analysis focuses on user and entity behavior, while anomaly analysis focuses on deviations from expected patterns and standards.
-
Data Sources: Behavioral analysis typically relies on a broader range of data sources, including user activity logs, network traffic, and system logs. Anomaly analysis can be applied to various data sources, including network traffic, system logs, and application logs.
In Summary:
Both behavioral analysis and anomaly analysis are crucial components of modern security solutions. By combining these techniques with other advanced methods like machine learning, organizations can significantly enhance their threat detection capabilities and improve their overall security posture.
-
-
Log Review and SIEM Tools Analysis

Log Review and SIEM Tools
Reviewing logs is crucial for keeping your systems secure. Instead of just looking at logs after something bad happens, you should regularly review them to spot potential threats early on.
Different systems create logs in different ways, so you need a system that can collect and analyze logs from all your devices. This helps you identify patterns and spot unusual activity that could signal a problem. By proactively analyzing logs, you can prevent security breaches and respond quickly to any issues that arise.
Security incidents aren’t always obvious. Sometimes, combining seemingly harmless events can reveal a bigger problem.
Example: Imagine Ben, a sales rep traveling to an another country, logs into the company network from one city. Shortly after, the system records her entering the office in another city. Individually, these events might seem normal. However, together they suggest a potential security issue, like someone might be impersonating Ben.
SIEM (Security Information and Event Management) systems help analyze these events in real-time. They collect logs from different sources, look for patterns, and alert you to potential threats.
To use SIEM effectively:
-
Focus on the right logs: Collect important information without overwhelming the system.
-
Clearly define what you’re looking for: Determine what constitutes a threat for your company.
-
Have a plan for responding to alerts: Know what to do when the system flags a potential issue.
-
Regularly review logs: Look for threats that might have slipped past the initial alerts.
SIEM helps you proactively identify and respond to security threats, making your organization more secure.
Splunk
Spliuk is a powerful tool used to collect and analyze large amounts of data from your computer systems and applications. It can gather information from various sources like operating systems and software, and store it for later analysis.
Splunk uses a special language (SPL) to search this data, allowing you to identify patterns and trends. The results can be displayed in easy-to-understand dashboards and reports, or even be used to trigger alerts when something suspicious is found.
Splunk can be installed on your own computers (local enterprise software) or accessed through the cloud. There are different versions available depending on your needs, including a free option for smaller networks and a security-focused edition with pre-built features for identifying and responding to security threats.
ELK Stack (Elastic Stack)
The ELK Stack, now known as the Elastic Stack with the addition of Beats, is a collection of open-source tools that provide Security Information and Event Management (SIEM) functionality. Here’s a breakdown of its components:
-
Elasticsearch: This is the engine behind the ELK Stack. It’s a powerful search and analytics tool that allows you to query and analyze the vast amount of data collected by the system.
-
Logstash: This tool acts as the central nervous system of the ELK Stack. It collects logs from various sources, parses them into a common format, and then ships them to Elasticsearch for storage and analysis.
-
Kibana: This is the visualization tool of the ELK Stack. It allows you to create dashboards and reports to easily understand the data collected by Logstash and stored in Elasticsearch. You can use Kibana to identify trends, patterns, and potential security threats.
-
Beats: These are lightweight agents that can be deployed on various devices (endpoints) to collect logs and send them to Logstash for further processing.
The ELK Stack is a versatile platform that can be implemented locally on your own servers or as a cloud-based service.
ArcSight
ArcSight, now owned by HP through Micro Focus, is a commercial SIEM solution that provides log management, analytics, and security intelligence. It goes beyond basic SIEM functionalities by offering features like:
-
Compliance reporting: ArcSight helps you generate reports to demonstrate compliance with various regulations such as HIPAA, SOX, and PCI DSS, which is crucial for many organizations.
-
Cybersecurity threat response: ArcSight provides tools and insights to help you identify, investigate, and respond to cybersecurity threats effectively.
QRadar
QRadar is IBM’s SIEM platform that offers log management, analytics, and compliance reporting functionalities. Similar to ArcSight, it provides a comprehensive solution for organizations looking to strengthen their security posture.
Alien Vault and OSSIM (Open-Source Security Information Management)
Alien Vault’s OSSIM (Open-Source Security Information Management) is a free and open-source SIEM product. Alien Vault also offers commercial versions of OSSIM with additional features and support. Here’s what makes OSSIM stand out:
-
Open-source integration: OSSIM can integrate with other popular open-source security tools like Snort (intrusion detection system) and OpenVAS (vulnerability scanner), allowing you to build a comprehensive security ecosystem.
-
Web-based management: OSSIM provides a user-friendly web interface for managing the entire security environment, simplifying administration tasks.
Graylog
Graylog is another open-source SIEM solution with a focus on enterprise needs. It also offers a commercial version that caters to compliance requirements and supports IT operations and DevOps teams.
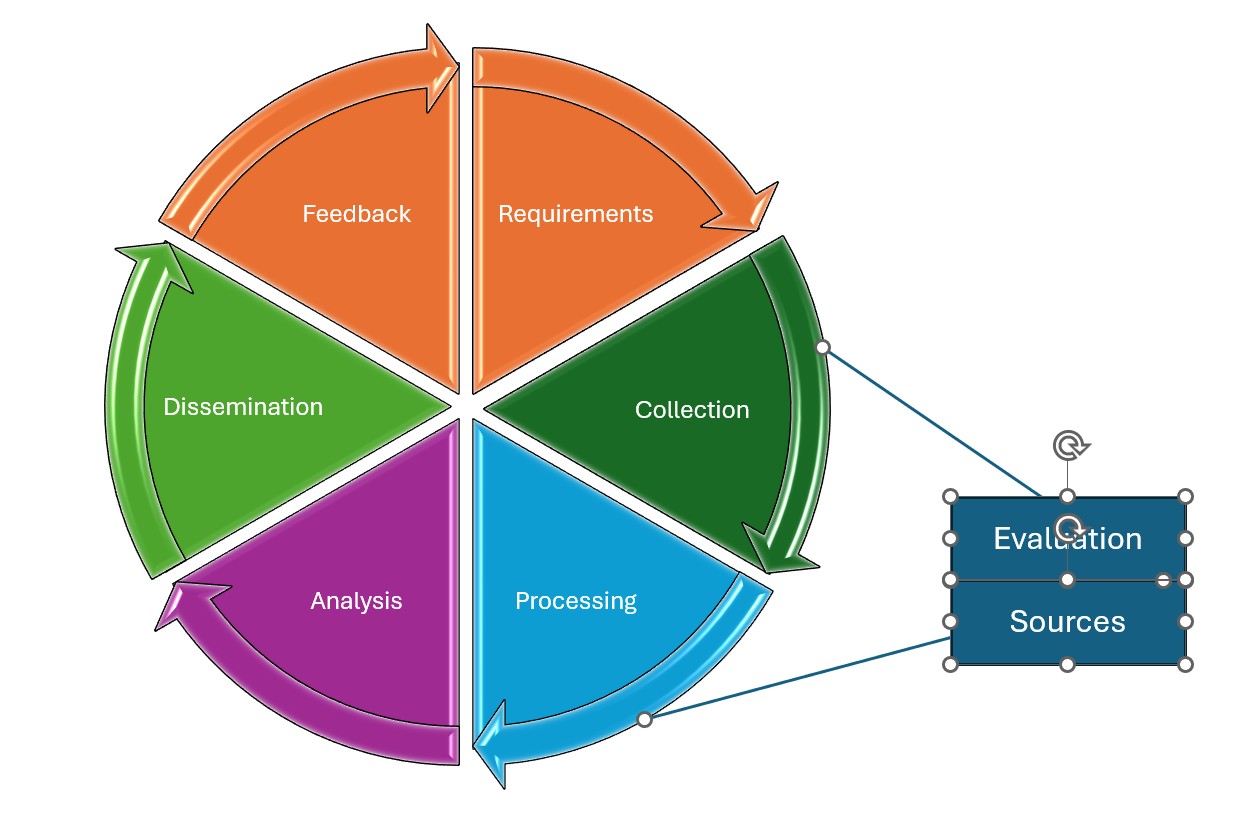
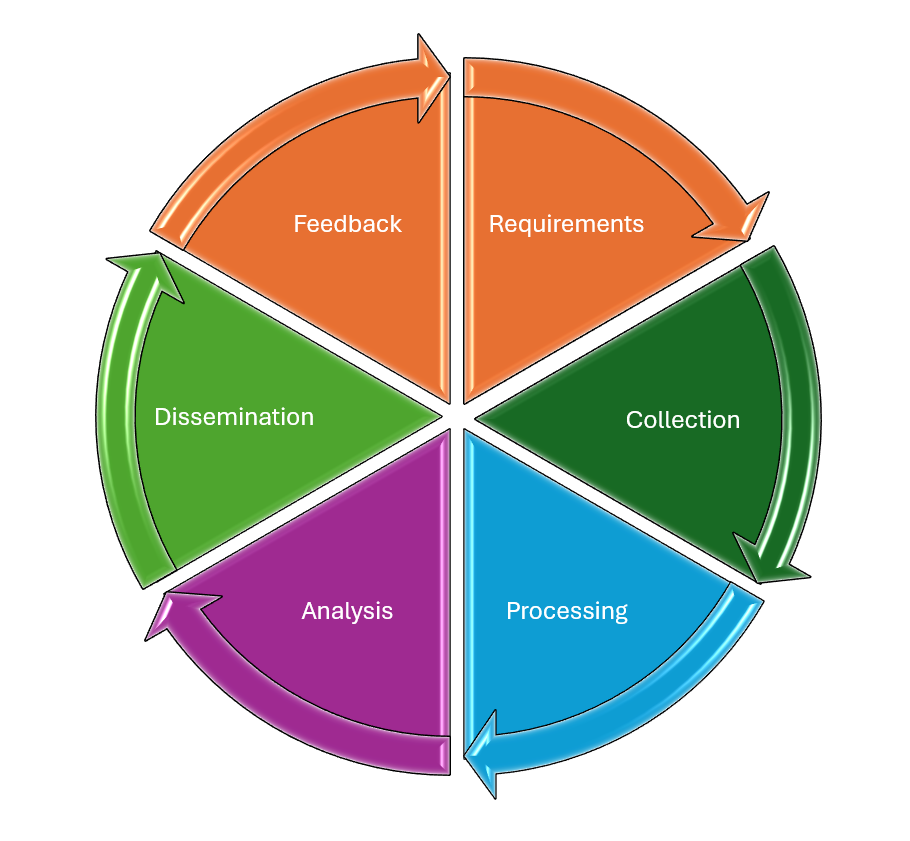
Security Data Collection and Use Cases
Security intelligence loses value quickly, making real-time or near-real-time analysis crucial. Timely insights can minimize or even prevent damage from attacks. 1 However, gathering and analyzing security intelligence is a complex process. It involves identifying relevant data, collecting it from various sources, transforming it into a usable format, aggregating and correlating different data points, analyzing the data to identify security patterns, and finally, determining appropriate responses to these identified threats. 2 This process often involves many tedious and time-consuming tasks.
SIEMs automate much of the security intelligence cycle, particularly data collection and processing, providing faster insights than manual methods. They can even automate some analysis, production, and dissemination tasks.
Effective SIEM implementation starts with careful planning. Collecting all logs is counterproductive. Focus on security-relevant events identified through risk management analysis. Excessive data overwhelms the SIEM, creates unnecessary network traffic, and increases analysis workload.
Early SIEMs were complex and often generated more noise than value. False positives and negatives are common. To mitigate these, develop “use cases” – specific conditions to be reported. For example, suspicious log-ons from privileged accounts to high-value assets. Use cases define data sources, correlation queries, and response actions.
Key considerations for use cases include:
-
When: Event start and end times.
-
Who: Involved users or entities.
-
What: Specific details of the event.
-
Where: Host, file system, network port, etc.
By carefully defining use cases, you can optimize your SIEM for maximum effectiveness and minimize the burden of managing security alerts.
Making Sense of Security Data: Security Data Normalization
Security data comes from various sources like network devices, servers, and user machines. This raw data often needs processing before it becomes useful for identifying security threats. Imagine searching for a specific book in a library. If all the books were piled haphazardly, finding the right one would be very difficult. Similarly, security data analysis requires organization for efficient threat detection.
This organization process is called security data normalization. It involves reformatting and restructuring security data to make it easier to analyze. Normalization ensures consistency across data formats, allowing for efficient pattern recognition and anomaly detection. This can be done manually by security analysts or through automation using SIEM (Security Information and Event Management) systems.
SIEMs collect data from various sources using different methods:
-
Agent-based collection: A lightweight agent software is installed on each device. This agent monitors the device for security events, filters and aggregates the relevant data, and then sends it to the central SIEM server for analysis and storage. Examples include Elastic Stack Beats agents for application logs and OSSEC for intrusion detection data.
-
Listener/collector method: Instead of agents, devices can be configured to send data directly to the SIEM server using protocols like syslog or SNMP (Simple Network Management Protocol). The SIEM server then parses and normalizes this data from various sources.
-
Sensor-based collection: SIEMs can also collect network traffic data using sensors deployed at strategic points on the network. These sensors capture and forward network traffic information to the central SIEM management system for analysis.
By collecting and normalizing data from various sources, SIEMs provide a holistic view of your security posture, helping you identify and respond to potential threats more effectively.
Parsing and Normalization: Making Security Data Speak the Same Language
Security data analysis is crucial for identifying and responding to potential threats. However, this analysis becomes a challenge when data comes from various sources, each with its own format. Imagine trying to understand a conversation where everyone speaks a different language. Security data normalization solves this problem by standardizing data formats, allowing SIEM (Security Information and Event Management) systems to effectively analyze information from diverse sources.
The Data Format Challenge
Security data comes in a multitude of formats, including:
-
Proprietary binary formats: Specific to a particular software or device.
-
Delimited formats: Separated by tabs (TSV) or commas (CSV).
-
Database log storage systems: Structured data stored in databases.
-
syslog: A common format for network device logs.
-
SNMP (Simple Network Management Protocol): Used for network device configuration and monitoring.
-
XML (eXtensible Markup Language) or JSON (JavaScript Object Notation): More structured formats gaining popularity.
These formats can vary in readability. Some are human-readable plain text, while others require specialized tools or parsers. Even seemingly simple differences like line endings (Linux vs Windows) or character encoding (ASCII, ANSI, Unicode) can create parsing challenges.
SIEM Connectors and Parsing: Unlocking the Code
SIEM solutions overcome these hurdles using connectors or plug-ins. These act as translators, interpreting (parsing) logs from different systems and accounting for vendor-specific variations. Parsing typically involves regular expressions, which are powerful tools for pattern matching in text. SIEMs use these regular expressions tailored to each log format to identify specific data points (attributes and content) within the logs. These data points are then mapped to standard fields within the SIEM’s reporting and analysis tools.
Date and Time Synchronization: Putting Events in Order
Another challenge is timestamp consistency. Devices might have incorrect internal clocks, use different time zones, or record timestamps in non-standard formats. This makes it difficult to correlate events and reconstruct the sequence of activities. To ensure accurate timeline analysis, it’s crucial to synchronize all logging sources to a common time reference using Network Time Protocol (NTP). SIEMs also need to handle variations in time zones and daylight saving time consistently. If automatic correction isn’t possible, enforcing a standard timestamp format (like RFC 3339) across all logging sources can help mitigate this issue.
Security and Resource Considerations for SIEMs
Security is paramount when dealing with logs. SIEMs need secure channels to prevent attackers from tampering with data in transit. Additionally, the SIEM data store itself must adhere to the CIA triad:
-
Confidentiality: Only authorized users should be able to access log data.
-
Integrity: Data must be protected from unauthorized modification.
-
Availability: Security measures shouldn’t hinder authorized access to log data for analysis.
Finally, logging can be resource-intensive. Large organizations can generate massive amounts of data (gigabytes or even terabytes per hour). This requires significant storage capacity (disk space) and processing power (CPU and memory) to handle data analysis. SIEM deployments need to be adequately resourced to ensure efficient log collection, storage, and analysis.
By addressing these data format challenges, time synchronization considerations, and security and resource requirements, SIEMs can effectively transform raw security data into actionable intelligence, empowering organizations to proactively identify and respond to security threats.
Event Logs: Unveiling the System Story
Event logs are the silent chroniclers of a system’s activity, recording every interaction between users, software, and the operating system itself. These logs serve as a vital source of security information, providing insights into potential threats and system health.
Understanding Log Formats and Content
The structure and content of event logs vary depending on the operating system. Common platforms like Windows, macOS, and Linux each have their own logging mechanisms. Often, the type of information captured within these logs can be customized to meet specific needs.
Events are categorized based on their nature and the area of the operating system they impact. Here’s a breakdown of the five main categories of Windows event logs:
-
Application: Tracks activity from applications and services, including failures like a service that can’t start.
-
Security: Records security-related events, such as failed login attempts or denied file access.
-
System: Captures events generated by the operating system and its core services, like monitoring storage health.
-
Setup: Logs events related to the Windows installation process.
-
Forwarded Events: Contains events sent from other computers to the local machine.
Within some of these categories, events are further classified by severity:
-
Information: Records successful events.
-
Warning: Flags potential issues that might become problems in the future.
-
Error: Indicates significant problems that can impact system functionality.
-
Audit Success/Failure: Unique to the Security log, these events track whether a user or service complied with system access policies.
Centralized Logging with syslog
For non-Windows systems, syslog reigns supreme. Designed for a client-server model, syslog facilitates the centralized collection of events from diverse sources. It also uses an open format for event messages, making it a widely adopted standard for logging in distributed systems. Devices like Cisco routers, switches, servers, and workstations can all generate syslog messages that are then collected in a central database for analysis. syslog leverages TCP/IP protocol and typically operates on UDP port 514.
By understanding event log formats, content, and management tools like syslog, security professionals gain valuable insights into system behavior. These insights are crucial for identifying security threats, troubleshooting system issues, and maintaining overall system health.
-
-
Email and Phishing Attack

Email phishing and impersonation attacks:
Email phishing and impersonation attacks trick you into thinking an email is from someone you trust, often using stolen information to make it seem real. Be careful and look for clues that might reveal the email is fake.
Impersonation:
-
Account Hijacking (BEC): Attackers gain access to a user’s email account (e.g., through compromised devices or cloud services). This allows them to impersonate the user and request sensitive information.
-
Example: An employee receives an email from their manager requesting confidential information. The email has poor grammar and spelling, but it’s from the manager’s actual account, making it more believable and potentially more dangerous.
-
-
Email Address/Domain Spoofing: Attackers forge the sender’s email address or domain. This is common for targeting high-level individuals.
-
Detection: Carefully examining the email headers can often reveal spoofing attempts.
-
Forwarding:
-
Phishing emails may appear to be part of a reply or forward chain.
-
Bulk Phishing: This tactic is often unconvincing in mass campaigns.
-
Spear Phishing: More effective in targeted attacks where the attacker has access to genuine email content.
-
Detection: Analyzing email headers can help identify the true sender.
-
Email Message Internet Header Analysis:
Email headers are like a behind-the-scenes record of an email’s journey. They contain information about who sent the email, who it’s going to, and the path it took through different servers on the internet.
When you send an email, your email software (MUA) creates a basic header. Then, your email server (MDA) checks if you’re allowed to send emails from that account and adds its own information to the header. The email then travels through other servers (MTAs) on its way to the recipient, and each server adds its own information to the header. By analyzing the header, you can see the email’s complete journey and identify any potential issues or signs of tampering.
Email Malicious Content Analysis
Attackers use spoofing and impersonation techniques to trick victims into responding to emails. To complete the attack, they often include a harmful component called a malicious payload.
Emails use a system called Multipurpose Internet Mail Extensions (MIME) to include different formats like HTML, Rich Text Format (RTF), and file attachments, which can be used to deliver these payloads.
Types of Malicious Payloads
-
Exploit
-
The email contains scripts or objects that take advantage of weaknesses in the email client (like how it handles RTF, HTML messages, image files, or S/MIME signatures).
-
Sometimes these can activate just by previewing the email.
-
To prevent this, it’s important to keep email software updated with the latest security patches.
-
-
Attachment
-
The email includes a file attachment designed to trick the user into opening or running it.
-
Attackers often disguise harmful attachments using file formatting tricks to make them appear harmless.
-
To trick you into clicking or opening something harmful, emails can contain hidden code or dangerous files.
-
Hidden Code (Exploits): This code can be cleverly disguised within the email itself (like in the text or images). It might try to take advantage of weaknesses in your email software to infect your computer.
-
Danger: Even just previewing the email can sometimes activate this hidden code.
-
Protection: Keep your email software and computer updated with the latest security patches.
-
-
Dangerous Files (Attachments): These are files attached to the email. They might look harmless (like a document or image), but they could actually contain viruses or other malware.
Email Signature Blocks
-
A missing or weird signature: If an email you receive from someone you know lacks a signature or has a strange signature, it could be a fake email.
-
Sophisticated fakes: In some cases, attackers might steal a company’s signature style to make fake emails look more believable. These fake signatures might contain harmful links or incorrect contact information.
Email Server Security
-
Stopping fake senders: To prevent fake emails, many email servers use special records on the internet (called DNS records) to verify that the sender is actually allowed to send emails for that company.
In simpler terms:
Think of an email signature like your digital business card. It tells people who you are and how to contact you. If an email from someone you know is missing a signature or has a strange one, it might be a fake.
To help stop fake emails, many companies use special security measures to make sure only authorized servers can send emails from their domain. This helps prevent attackers from sending fake emails that appear to be from the company.
SPF (Sender Policy Framework):
SPF (Sender Policy Framework) is like a digital gatekeeper for emails. It’s a system that helps prevent fake emails (spoofing) by verifying that the email actually came from the sender it claims to be.
Here’s how it works:
-
A company creates an SPF record: This record lists all the servers that are allowed to send emails on behalf of their domain. Think of it like a list of approved senders.
-
The record is published: This list is publicly available on the internet through the Domain Name System (DNS).
-
Receiving servers check the record: When you receive an email, your email server checks the SPF record of the sender’s domain. If the email came from one of the approved servers listed in the record, it’s likely legitimate. If not, the server can take action, such as rejecting the email or marking it as suspicious.
DomainKeys Identified Mail (DKIM):
Imagine you want to send a secure message to a friend. With DKIM, you:
-
Create a secret code (private key): Only you know this code.
-
Share a public version of the code (public key): You publish this publicly so your friend can verify your messages.
-
Sign your message: You use your secret code to create a unique digital signature for your message. This signature is like a special seal that proves you sent the message.
-
Send the message: You include your signature with the message.
-
Your friend verifies the signature: Your friend uses your public code to check if your signature is valid. If it matches, they know the message truly came from you.
DKIM in email:
-
Email servers use this system to verify the authenticity of emails.
-
Companies publish their public keys in a special online directory (DNS).
-
When you send an email, your email server signs it with its secret key.
-
Receiving email servers check the signature using the company’s public key.
-
If the signature matches, the receiving server knows the email likely came from the company it claims to be from.
Benefits of DKIM:
-
Helps prevent spam and phishing: By verifying the sender’s identity, DKIM makes it harder for attackers to send fake emails.
-
Improves email deliverability: Emails with valid DKIM signatures are more likely to reach their intended recipients.
In essence, DKIM adds a layer of trust to emails, making them more secure and reliable.
DMARC (Domain-Based Message Authentication, Reporting, and Conformance):
DMARC (Domain-Based Message Authentication, Reporting, and Conformance) is like a security guard for your email domain. It helps prevent attackers from sending fake emails that appear to be from you or your company.
Here’s how it works:
-
Building on existing security: DMARC works together with two other email authentication protocols:
-
SPF (Sender Policy Framework): Verifies that emails claiming to be from your domain were actually sent by servers authorized to do so.
-
DKIM (DomainKeys Identified Mail): Digitally signs emails to prove their authenticity.
-
-
Setting the rules: You create a DMARC record for your domain, which is like a set of instructions for how to handle emails that fail authentication checks.
-
You can choose to:
-
Flag: Mark suspicious emails.
-
Quarantine: Move suspicious emails to your spam folder.
-
Reject: Block suspicious emails completely.
-
-
-
Getting reports: DMARC allows you to receive reports from other email providers about emails that failed authentication checks. This helps you identify and address any issues with your email setup.
In simpler terms:
Imagine you’re a business owner. DMARC is like installing a security system for your company’s email. It helps prevent scammers from sending fake emails that appear to be from your company, which can protect your customers and your brand reputation.
By implementing DMARC, you can significantly reduce the risk of phishing attacks, improve your email deliverability, and enhance your overall email security posture.
Cousin Domains
Cousin domains are look-alike domain names that closely resemble an organization’s real domain. These domains are often used in phishing attacks to trick recipients into thinking the email is legitimate.
Even though email authentication protocols like SPF, DKIM, and DMARC can protect against spoofing, they cannot prevent attacks using cousin domains. For example:
-
A real email might come from support@realcompany.serviceprovider.com.
-
A phishing email might use a similar address like support@reelcompany.serviceprovider.com or support@realcompany.srviceprovider.com to deceive recipients.
Phishers often exploit hosted email services commonly used for marketing, customer service, or support, making these attacks harder to detect.
SMTP Log Analysis
When investigating email abuse, analyzing SMTP logs can provide valuable insights. These logs record the communication between email servers. Key details include:
-
Time of Request/Response: The time when the local SMTP server communicates with the remote SMTP server.
-
Recipient Address: The email address the message is being sent to.
-
Message Size: The size of the email being sent.
Additionally, status codes in the logs show whether the remote server accepted or rejected a request:
-
Example: A 220 status code means the remote server is ready to communicate.
By carefully reviewing these logs, administrators can identify suspicious activity and investigate potential email abuse.
Email Message Security and Digital Signatures
While server security and email authentication help prevent account compromises and email spoofing, message authentication and confidentiality are still essential in many cases. One way to achieve this is through Secure/Multipurpose Internet Mail Extensions (S/MIME).
What is S/MIME?
S/MIME is a technology used to:
-
Add digital signatures to emails for authentication.
-
Encrypt email contents for confidentiality (optional).
How Does S/MIME Work?
-
Digital Certificate:
-
Each user receives a digital certificate containing their public key.
-
This certificate is signed by a Certificate Authority (CA) to prove its validity.
-
-
Key Pair:
-
The public key is paired with a private key.
-
The private key must be kept secret by the user.
-
-
Secure Email Exchange:
-
Both users must enable S/MIME.
-
They exchange their certificates to establish a secure communication channel.
-
-
-
Port security and NAC
Port Security Configuration Changes
Port security means blocking unauthorized application service ports on devices and firewalls, as well as securing the physical and remote access ports that let a device communicate on the local network.
Network Appliance Security
Compromising network devices like switches, routers, and firewalls can allow an attacker to gather information and spread their attack throughout the network.
These devices can also be targets of Denial of Service (DoS) attacks. Just like servers, network appliances can have software vulnerabilities that need regular updates and patches.
To secure these devices:
-
Stay Updated: Make sure the device vendor regularly provides reports on vulnerabilities and patches to keep the software up to date. Many problems come from using outdated software.
-
Secure Access: Ensure that access to the management features of these devices is secure. They often have web interfaces that can have vulnerabilities, like cross-site scripting attacks.
-
Use Secure Connections: It’s usually safer to manage these devices through secure command-line interfaces (SSH) rather than web browsers.
-
Limit Internet Access: If possible, restrict the management stations that configure these devices from accessing the Internet. This reduces the risk of getting compromised through web browser security flaws.
By following these steps, you can help protect your network appliances from potential attacks.
Physical Port Security and MAC Filtering
When firewall, proxy, and IDS logs indicate that unauthorized devices are connecting to the network, it’s essential to review port security methods. Network access can be controlled using physical port security, MAC filtering, or a Network Access Control (NAC) solution.
For wired ports:
-
Secure Access: Limit access to physical switch ports and hardware to authorized personnel only. This can be done by using secure server rooms or lockable cabinets for hardware.
-
Disable Ports: To prevent unauthorized devices from connecting, you can disable switch ports through management software or physically remove the patch cable from the port. However, this approach can create administrative challenges and is prone to errors.
-
Incomplete Protection: Simply disabling ports does not provide complete security. An attacker could unplug a device from an enabled port and connect their own unauthorized device.
To enhance security, more advanced methods have been developed, as traditional approaches may not be sufficient to fully protect the network.
MAC Filtering
MAC filtering is a method used to control which devices can connect to a specific switch port by specifying the allowed MAC addresses. Here’s how it works:
-
Static Method: You can create a list of valid MAC addresses that are permitted to connect. However, this method can be hard to maintain and is prone to errors as devices are added or removed from the network.
-
Dynamic Learning: Some switch models offer a more flexible approach by allowing you to set a limit on the number of allowed MAC addresses. For example, if port security is set to allow a maximum of two MAC addresses, the switch will remember the first two devices that connect to that port. Any other devices trying to connect will have their traffic dropped, effectively preventing unauthorized access.
This way, MAC filtering helps improve security by ensuring that only known devices can access the network through specific switch ports.
physical and logical ports. It prevents unauthorized devices from connecting to the network, mitigating risks such as data breaches and attacks.
Physical Port Security: This involves restricting physical access to network hardware and ports. Measures include securing switch ports, disabling unused ports, and ensuring only authorized personnel can access networking equipment.
While effective, physical security should be complemented by additional methods to safeguard against potential attacks.
MAC Filtering: MAC filtering enhances security by specifying which devices can connect to a switch port based on their MAC addresses. While it offers a layer of protection, maintaining an accurate list of allowed MAC addresses can be challenging.
Dynamic learning capabilities can simplify management but still require oversight to ensure that the security posture remains robust.
In summary, a comprehensive approach to port security that combines physical security, MAC filtering, and ongoing monitoring is vital for safeguarding network environments against unauthorized access and potential threats.
Network Access Control (NAC) Configuration Changes
If security monitoring finds serious threats from unauthorized devices on the network, just using physical port security and MAC filtering might not be enough. Network Access Control (NAC) is a solution that helps verify who is using the network and checks if their devices are secure before allowing them to connect.
This means that NAC can better protect the network by ensuring only trusted users and devices can access it.
IEEE 802.1X Port-based NAC (PNAC)
The IEEE 802.1X standard outlines a method called port-based Network Access Control (PNAC). This means that when a device wants to connect to the network, the network device (like a switch or router) first asks for authentication before opening the port for access.
Here’s how it works:
-
The device trying to connect is called the supplicant.
-
The network device that requests the authentication is known as the authenticator.
-
The authenticator uses a protocol called EAPoL (Extensible Authentication Protocol over LAN) to communicate with the supplicant and wait for it to provide its authentication details.
-
The authenticator sends these details to an authenticating server, which checks whether they are correct.
-
If the credentials are valid, the server grants access, and the network device sets up the port to allow normal network traffic by assigning the correct VLAN and subnet to the connection.
This process helps ensure that only authorized devices can access the network.
NAC Policies and Admission Control
While 802.1X focuses on authenticating devices trying to connect to the network, a more comprehensive Network Access Control (NAC) solution allows administrators to create policies that define the minimum security standards devices must meet to gain access. These policies are known as health policies.
Typical health policies check for the following:
-
Malware infection: Ensuring that the device is not infected with any malicious software.
-
Firmware and OS patch levels: Checking if the device’s operating system and firmware are up-to-date with the latest security patches.
-
Host firewall/IDS status: Verifying that the device’s firewall or Intrusion Detection System (IDS) is active and functioning.
-
Up-to-date virus definitions: Making sure the device has the latest virus definitions for its antivirus software.
Additionally, a NAC solution may be able to:
-
Scan the Registry: Checking system settings and configurations.
-
Perform file signature verification: Ensuring that critical files are intact and have not been tampered with.
These health policies help ensure that only devices meeting specific security standards can connect to the network, enhancing overall security.
Key Features of NAC Solutions
1. Posture Assessment:This feature involves evaluating the endpoint device to ensure it complies with the health policy. Information can be collected from the device in two ways:
-
Agent Installation: Installing software on the device that provides compliance information.
-
Polling: Regularly checking the device for compliance without needing an installed agent.
2. Remediation:This is what happens when a device does not meet the security profile. Options include:
-
Refusing Connection: The device may be completely denied access to the network.
-
Captive Portal: The device is placed in a restricted access area where it cannot connect to the general network. In this state, the user may be prompted to install required updates or security patches.
3. Pre- and Post-Admission Control:
-
Pre-Admission Control: Most NAC solutions require that devices meet the health policy before they can connect to the network.
-
Post-Admission Control: This involves regularly checking devices after they have been granted access to ensure they continue to meet compliance standards. Some NAC solutions may focus only on post-admission control, while others may implement both pre- and post-admission controls.
These features work together to enhance network security by ensuring that only compliant devices can connect and remain connected.
Types of Policies in Network Access Control (NAC)
NAC solutions can support various policies and criteria for granting or denying network access. Here are some of the key types:
1. Time-based Policies:
-
Access Periods: These policies define specific times when hosts can access the network.
-
Usage Windows: For example, access can be limited to certain hours, preventing users from connecting outside those times.
-
Concurrent Log-ons: Some solutions allow users to connect multiple devices (like a PC and smartphone) simultaneously, while blocking any additional devices.
2. Location-based Policies:
-
Geographic Location: These policies evaluate where the endpoint requesting access is located, using services that can pinpoint the device’s location.
-
IP Reputation: Access can be blocked based on IP addresses or subnets that are known to be suspicious.
-
Internal Network Monitoring: This policy helps prevent access attempts that aim to bypass firewalls within different parts of the internal network.
3. Role-based Policies:
-
Adaptive Access: NAC re-evaluates authorization based on what the device is trying to do.
-
Specific Functions: For example, if a device tries to access a subnet meant for server management, it checks whether the user account or device is authorized for that role. If not, NAC may shut down access or issue an alert.
4. Rule-based Policies:
-
Logical Statements: These complex policies enforce a series of rules defined as logical statements (e.g., IF condition A AND condition B THEN grant access). This approach allows for flexible and granular access control.
These diverse policy types help organizations tailor their network access controls to better fit their specific security needs and operational requirements.
-
-
IDS and IPS
IDS and IPS Configuration
An Intrusion Detection System (IDS) works by monitoring network traffic to detect suspicious activities. Here’s how it operates:
-
Packet Sniffer: An IDS acts as a sensor that captures network packets and sends them to an analysis engine.
-
Analysis Engine: This engine uses a set of rules to identify malicious traffic and generates event logs, notifications, or alerts when suspicious activity is detected.
-
Placement: IDS sensors are usually placed inside a firewall or near critical servers. This helps in identifying any harmful traffic that may have bypassed the firewall.
-
Traffic Monitoring: In a switched network, the IDS sensor needs to be connected to a spanning port on the switch. This allows it to monitor traffic on other ports (a process known as port mirroring). If the switch doesn’t support spanning ports, you can use a Test Access Port (TAP), which connects directly to the network media to capture traffic.
An Intrusion Prevention System (IPS) works similarly but takes it a step further by actively blocking or preventing detected threats, rather than just alerting administrators.
Understanding how to configure and utilize IDS and IPS systems is essential for maintaining network security and detecting potential threats effectively.
Intrusion Detection Systems (IDS) vs. Intrusion Prevention Systems (IPS)
Intrusion Detection Systems (IDS) and Intrusion Prevention Systems (IPS) serve important roles in network security, but they function differently:
-
Intrusion Detection System (IDS):
-
Passive Detection: IDS primarily focuses on monitoring network traffic to detect suspicious activities. It logs incidents and alerts administrators when a potential intrusion is identified.
-
Alerting: When an event is flagged as high priority, the IDS can send notifications via the management interface or email the administrator.
-
-
Intrusion Prevention System (IPS):
-
Active Prevention: An IPS not only detects threats but also takes action to block malicious traffic. It uses a data acquisition (DAQ) module to manage this process.
-
Traffic Blocking: The IPS can block traffic through specially configured virtual interfaces (like Afpacket) or collaborate with firewalls (using tools like NFQ for iptables/NetFilter or IPFW for BSD-based firewalls).
-
Custom Actions: The IPS may also run scripts or third-party programs to perform additional actions not directly supported by the IPS software.
-
In summary, while IDS provides alerts and logs for detected threats, IPS actively prevents those threats from causing harm by blocking the malicious traffic.
Examples of IDS/IPS Solutions
Several effective open-source solutions are available for Intrusion Detection Systems (IDS) and Intrusion Prevention Systems (IPS):
-
Snort:
-
Overview: Snort is a widely used open-source IDS that can be installed on selected Linux distributions and Windows.
-
Cost: The installation packages are free, but a subscription (known as “oinkcode”) is required for the latest rulesets to ensure the detection engine can identify current threats. Community-authored rulesets are available for non-subscribers.
-
Operation Modes: Snort can operate in various modes:
-
Sniffer-Only Mode: Monitors traffic without taking action.
-
Log-Only Mode: Records traffic data for later analysis.
-
Prevention Mode: Actively responds to threats by shutting down anomalous traffic using TCP resets and ICMP unreachable messages.
-
-
-
Zeek (formerly Bro):
-
Overview: Zeek is an open-source IDS specifically designed for UNIX/Linux platforms.
-
Functionality: Zeek uses a scripting engine to respond to significant network events (called notices). It can generate alerts or implement mechanisms to block suspicious activities.
-
-
Security Onion:
-
Overview: Security Onion is a comprehensive open-source platform for security monitoring, incident response, and threat hunting.
-
Bundled Tools: It integrates several tools, including:
-
Snort and Suricata: For network intrusion detection and prevention.
-
Zeek: For network monitoring and analysis.
-
Wireshark and NetworkMiner: For packet analysis and forensics.
-
Log Management Tools: Such as Elasticsearch, Logstash, and Kibana for analyzing and visualizing log data.
-
Incident Management Tools: Like Sguil and Squert for managing and analyzing security incidents.
-
-
These tools provide robust solutions for monitoring network activity, detecting threats, and managing security incidents effectively.
IDS and IPS Log Review
When an Intrusion Detection System (IDS) or Intrusion Prevention System (IPS) detects suspicious activity, it creates a log entry every time a predefined rule is matched. Depending on how the system is set up, these log entries can also trigger alerts or notifications, such as emails.
One of the main challenges when using an IDS is fine-tuning the system to avoid generating too many alerts (overalerting) while still being sensitive enough to catch genuine incidents. Most IDS software, like Snort, offers various output formats for logs, including:
-
Unified Output:
-
This format creates binary files that are machine-readable. It’s fast but requires special tools to interpret the data for human reading.
-
-
Syslog:
-
This format records event details (like IP addresses, port numbers, and the matched rule or signature) using the standard syslog format.
-
-
Comma-Separated Values (CSV):
-
This format uses commas to separate fields, making it easier to import into other applications or to parse with regular expressions.
-
-
Tcpdump:
-
This format captures the packets involved in the event using the pcap file format.
-
Logs can be directed to files or to a centralized log server, such as a Security Information and Event Management (SIEM) system. Typically, IDS logs are not analyzed directly as source files. Instead, alerts are monitored in real-time using console applications or dashboards. Security analysts then assess whether each alert needs to be escalated to an incident status for further investigation.
IDS and IPS Rule Changes
Intrusion Detection Systems (IDS) and Intrusion Prevention Systems (IPS) rely on predefined rule signatures to identify malicious traffic. Security researchers create these signatures based on known threats.
Most of the time, rule changes are made to improve the accuracy of the system and reduce false negatives—instances where the system fails to detect a real threat. If a rule consistently generates alerts that do not need further investigation, it may be disabled.
In some cases, new rules or customized versions of existing rules may need to be added. Generally, a Snort rule has a specific structure that includes a header and payload. Here’s a simplified breakdown of the structure:
-
Action: The action to take when the rule matches (e.g., alert, log, pass, drop, or reject).
-
Protocol: The type of protocol (e.g., TCP, UDP).
-
Source IP: The IP address of the sender.
-
Source Port: The port number used by the sender.
-
Direction: The flow of traffic (either from source to destination or vice versa).
-
Destination IP: The IP address of the receiver.
-
Destination Port: The port number used by the receiver.
-
Rule Options: Additional parameters or conditions for the rule (specified within parentheses).
For example, the source and destination addresses and ports can use static values or keywords like any, or variables defined in the Snort configuration file (e.g., $EXTERNAL_NET and %HOME_NET). The direction of the traffic can be specified as one-way (using -> or <-) or bidirectional (using <>).
Common Options for IDS/IPS Rules
When configuring rules in an Intrusion Detection System (IDS) or Intrusion Prevention System (IPS), you can use various options to specify how the rule behaves. Here are some of the common options:
-
msg: This option allows you to include a message that describes what triggered the rule. It helps responders understand the nature of the alert.
-
flow: This option specifies whether to match a new or existing TCP connection, or to match regardless of the TCP connection state. This is useful for identifying the context of the traffic.
-
flags: You can use this option to match specific flags in the packet, such as when both the TCP SYN and FIN flags are set. This can indicate unusual behavior.
-
track: This option applies a rate limiter to the rule, meaning the rule will only trigger if a certain number of events exceed a specified threshold within a defined time period. This helps reduce false alerts.
-
reference: This option allows the rule to match entries in an attack database, like CAPEC or MITRE ATT&CK, which provides additional context about known attacks.
-
classtype: This option is used to categorize the type of attack the rule is designed to detect, making it easier to analyze trends and incidents.
-
sid and rev: The sid (signature ID) provides a unique identifier for the rule, while rev (revision number) indicates the version of the rule. This helps in managing and tracking changes to rules over time.
Conclusion on IDS and IPS
Intrusion Detection Systems (IDS) and Intrusion Prevention Systems (IPS) are essential components of a comprehensive cybersecurity strategy. They work together to monitor network traffic, identify potential threats, and respond appropriately to mitigate risks.
-
IDS focuses on detecting suspicious activities and generating alerts for further investigation. Its primary role is passive monitoring, allowing security teams to analyze logs and take action as needed. However, tuning the system to minimize false positives while maintaining sensitivity is crucial for effective detection.
-
IPS, on the other hand, actively prevents intrusions by blocking malicious traffic in real-time. It can operate alongside firewalls and utilizes predefined rule sets to identify and mitigate threats. The ability to customize rules allows organizations to adapt their security measures to emerging threats and specific network conditions.
Both systems rely on predefined signatures and rules to detect known threats, but they also require regular updates and adjustments to stay effective. Tools like Snort and Zeek provide robust solutions for IDS and IPS implementations, while platforms like Security Onion integrate various security monitoring tools for a more holistic approach.
Ultimately, the effective use of IDS and IPS helps organizations protect sensitive data, maintain regulatory compliance, and respond to security incidents efficiently. Regular log review, rule updates, and continuous tuning are vital for maximizing the efficacy of these systems in today’s evolving threat landscape.
-
-
Proxy

Proxy Log :
A forward proxy is used to manage internal network traffic by forwarding users’ requests (like browsing websites) to the intended destination on the internet. It’s commonly used in environments where traffic needs to follow security or administrative rules.
There are two types of proxies:
-
Non-transparent proxy: Users need to configure their devices to connect to the proxy.
-
Transparent proxy: The proxy automatically intercepts traffic without needing any changes to the users’ devices.
Proxies help monitor, control, and secure outgoing traffic and are often logged to review compliance and spot security issues.
Analyzing proxy logs helps understand what websites users visit and the content of their requests. It can prevent users from unintentionally accessing dangerous sites like malware sources.
Proxies often use formats like the Common Log Format to record data. Each log entry contains important details, such as:
-
User ID: Who made the request (if authenticated).
-
Request method: Whether the user accessed or submitted information (GET or POST).
-
HTTP status code: How the server responded.
-
Size and type of resource: What was returned, including the type of content (e.g., HTML, image).
Proxies can also track if a request violated any rules, helping assess user intent, whether harmless or suspicious.
It listens for requests from users on the Internet, forwards those requests to the correct internal server, and then sends the server’s response back to the user.
By analyzing logs from a reverse proxy, you can look for signs of attacks or security breaches. This includes checking for malicious code in request headers or URLs. You can also analyze response codes to spot unusual patterns or behaviors compared to normal traffic, which can help identify potential security issues.
Conclusion on Proxy and Reverse Proxy
Proxy: A proxy server acts as an intermediary between users and the internet, forwarding requests on behalf of internal hosts. It helps enforce security policies, monitor user activity, and prevent access to malicious sites. Analyzing proxy logs provides valuable insights into user behavior and request patterns, helping organizations maintain security and compliance. By capturing detailed information about HTTP requests, proxies can effectively manage
Reverse Proxy :
A reverse proxy handles incoming traffic meant for a specific service. and control outbound traffic.
Reverse Proxy: A reverse proxy serves as a gateway for incoming traffic to internal servers, allowing external users to access services without directly connecting to the internal network. It enhances security by hiding internal server details and can help detect and mitigate attacks through log analysis. By monitoring response codes and request patterns, reverse proxies can identify anomalies and potential threats, thereby strengthening the organization’s overall security posture.
-