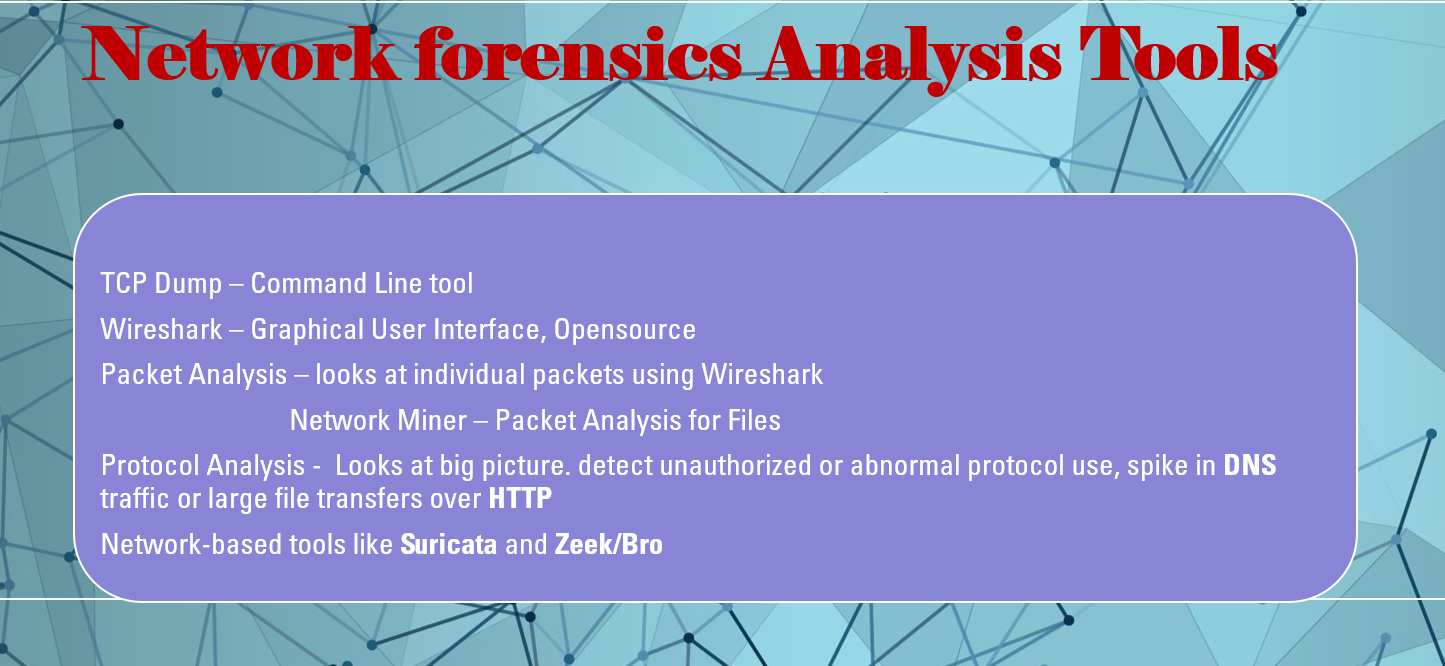
Network Forensics Analysis Tools
Network forensics tools are used to capture and analyze data as it moves through a network. These tools can monitor network traffic by capturing data from either a single computer (host) or an entire network segment. When capturing from a network, a device like a SPAN port or TAP is used to copy data as it passes through. Sniffers are often placed near important servers or inside firewalls to catch any harmful traffic that bypasses the firewall. Since sniffers can collect a large amount of data, only a few are typically used to monitor key areas. Two popular tools for this are tcpdump and Wireshark or to analyze a PCAP file of saved network data, which allow you to capture and analyze network data in real-time or review saved data files.
tcpdump :
tcpdump is a command-line tool used on Linux to capture and display network traffic in real-time. There is a version for Windows called windump. To use tcpdump, you run the command tcpdump -i eth, where “eth” is the network interface you want to monitor. You can also use the keyword “any” to listen to all network interfaces on a system. tcpdump will keep capturing packets until you stop it by pressing Ctrl+C. It’s a powerful tool for network analysis and troubleshooting.
The operation of the basic command can be modified by switches.
Switch:
-n Show addresses in numeric format (don’t resolve host names).
-nn Show address and ports in numeric format.
-e Include the data link (Ethernet) header.
-v, -vv, -vvv Increase the verbosity of output, to show more IP header fields, such as TTL.
-X Capture the packet payload in hex and ASCII.
-XX to include the data link header too.
-s Bytes By default, tcpdump captures the first 96 bytes of the data payload. To capture the full payload, set the snap length to zero with -s 0.
-w file Write the output to a file. Packet capture files are normally identified with a .pcap
extension.
-r file File Display the contents of a packet capture file. There are numerous filter options, which can be combined using logical and (&&), or (||), not (!), and groups (parentheses).
Host Capture source and destination traffic from the specified IP or host name.
src / dst Capture only source or destination traffic from the specified IP.
net Capture traffic from the specified subnet (use CIDR notation).
port Filter Filters to the specified port (or range of ports, such as 21-1024). You can also use src port or dst port.
proto Filter proto Filter to a protocol, such as ip, ip6, arp, tcp, udp, or icmp
Wireshark :
Wireshark is a free, open-source tool that lets you capture and analyze network traffic through a graphical interface. It works on most operating systems. Once you choose which network interfaces to monitor, Wireshark displays the captured data in three panes: the top shows each packet, the middle shows details of the selected packet, and the bottom shows the raw data in both hex and text formats. Wireshark can interpret hundreds of network protocols and lets you filter results, either by using the same syntax as tcpdump or with easy-to-use graphical tools. You can save or load capture files in .pcap format for analysis. Wireshark also has powerful display filters and lets you customize how packets are highlighted. A handy feature is Follow TCP Stream, which helps you reconstruct the contents of a TCP session for easier analysis.
Packet Analysis :
Packet analysis means closely examining each piece of data (called packets) that travels over a network, usually using a tool like Wireshark. By looking at packets one by one, you can detect if they have been changed in unusual ways while using standard network ports. For example, altered packets might be used to secretly communicate with a Command and Control (C&C) server. By inspecting the contents of these packets (the protocol payloads), you can spot attempts to steal data or efforts to connect to suspicious websites and URLs.
Packet Analysis for File Extraction :
One use of packet analysis is to identify and extract files, like binary data, being sent over a network. Tools like NetworkMiner can rebuild files from captured network traffic, even if the data was sent out of order. These tools remove protocol details and save the file for analysis, often detecting file types, such as Windows executable (PE) files, which could be malware. To extract files, the tool must support the network protocol used (e.g., HTTP, FTP, or SMB). Network-based tools like Suricata and Zeek/Bro can also do this. However, attackers may try to hide files by altering the data or removing important file identifiers, making extraction harder.
Protocol Analysis :
Protocol analysis involves using statistical tools to examine patterns in network traffic over time, helping to spot unusual behavior. Unlike packet analysis, which looks at individual packets in detail, protocol analysis looks at the bigger picture, such as the number and size of packets exchanged between hosts. For example, a few small packets sent with regular pauses might indicate an interactive session, while many large packets could mean a file transfer. By analyzing protocol statistics and comparing them to normal traffic patterns, you can detect unauthorized or abnormal protocol use, such as a spike in DNS traffic or large file transfers over HTTP at odd times. These could signal security issues or network intrusions. Visualization tools are often used to spot such anomalies more easily.
Leave a Reply